As part of the development of several integrations to one of our clients, we were requested to provide a solution for Azure monitoring Logic Apps with Log Analytics.
So, in this post, I’ll show how we can do this by using Log Analytics with the Logic Apps Management solution.
There are several posts out there explaining how to do this, but I still had a lot of doubts with some configurations, and since this implementation took me a long time to understand some behaviors I’ll try to lighten them up here.
Creating the Log Analytics OMS Workspace
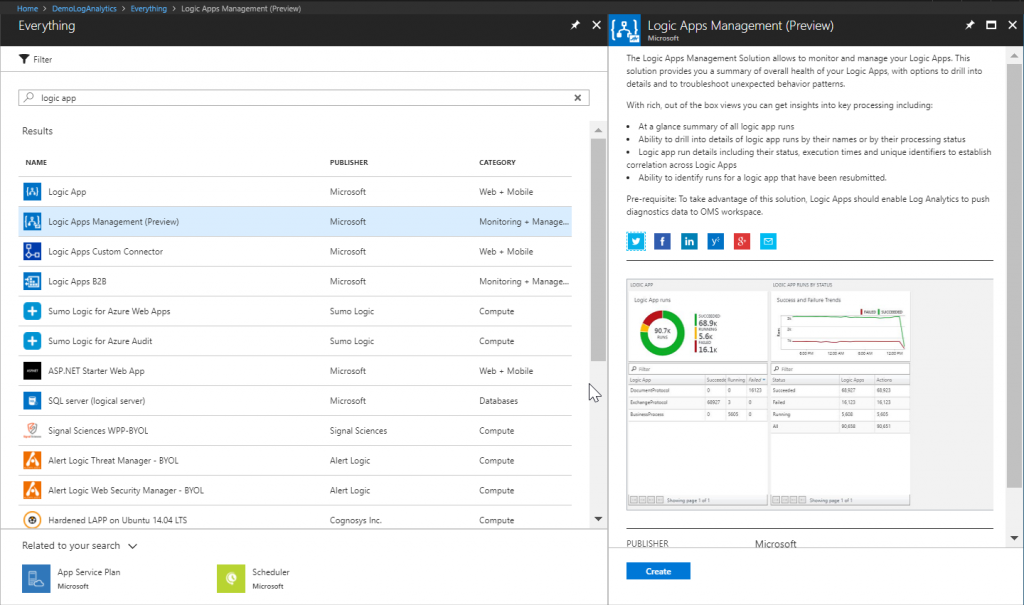
The first thing we need to do is to create the Log Analytics OMS Workspace. There are several options, but one that does all at once is to add a new resource called Logic Apps Management (Preview) as the picture below.
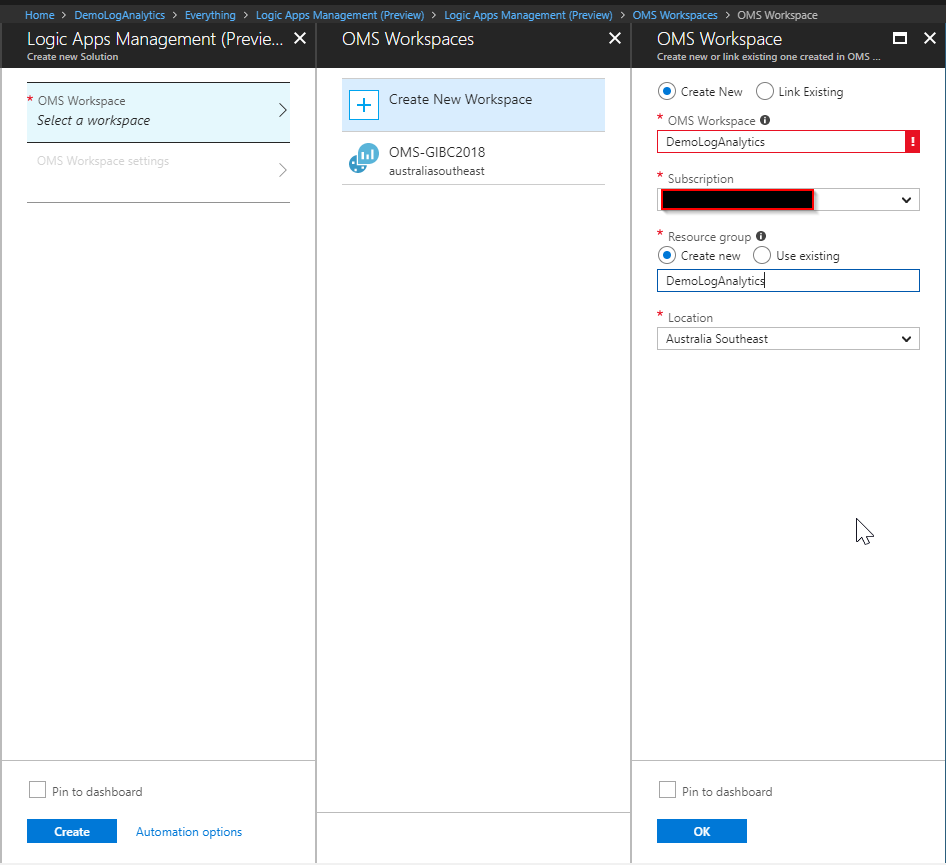
The next step is to create the OMS workspace. As usual, to do so select a subscription, a resource group (new or existing) and the location. Hit OK and Create. It will take some minutes for the creation to be complete.
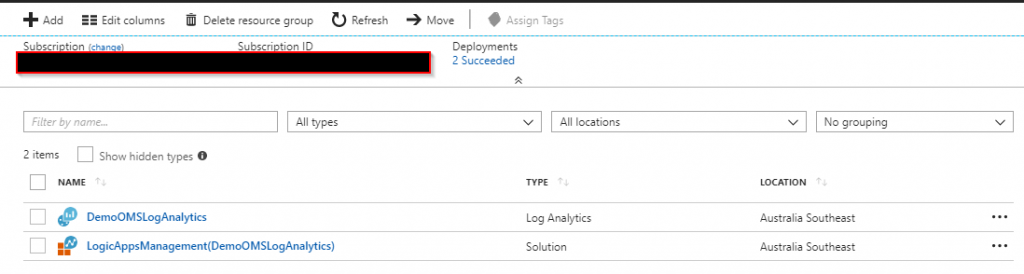
When the creation is complete you will see two resources created. One for the Log Analytics workspace and one for Logic Apps Management solution that runs on top of it. This solution provides a dashboard and a set of queries on the data that is stored in the Log Analytics.
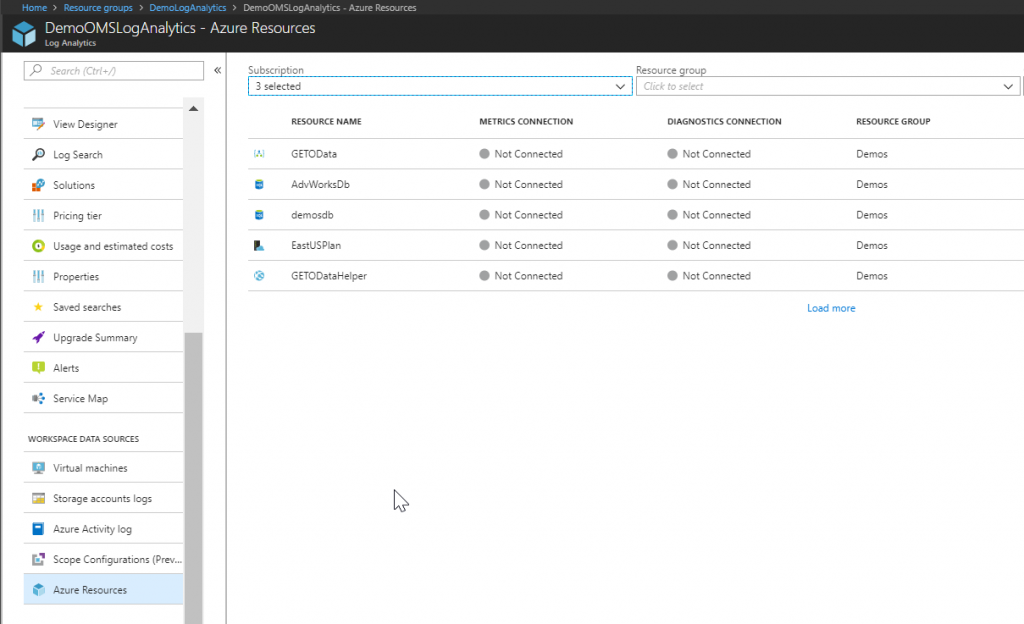
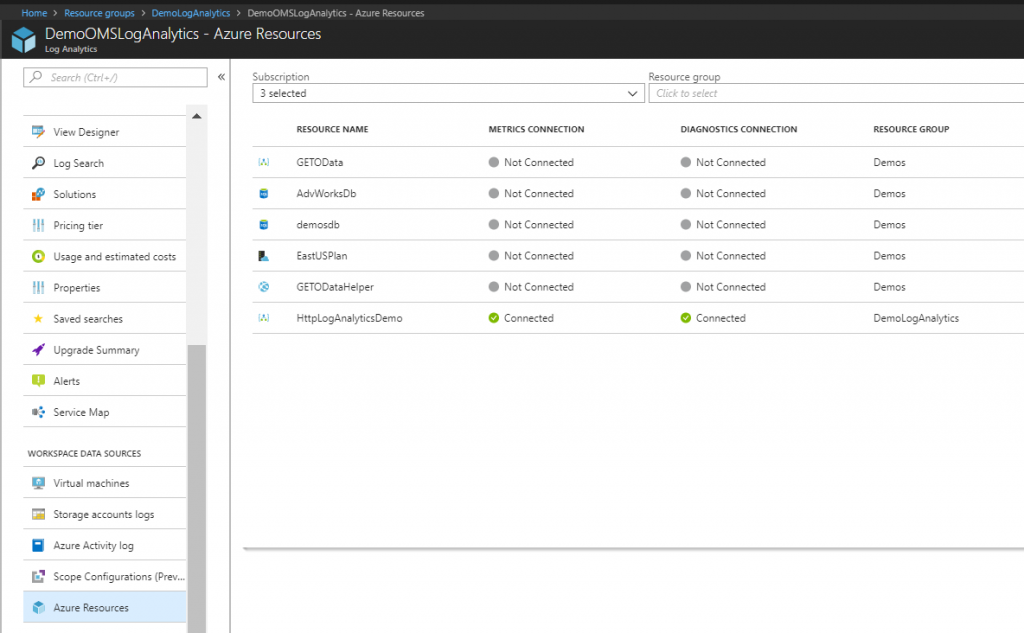
Click on the Log Analytics workspace and navigate in the Azure Resources. You will see that now, there’s no connection established with any data source.
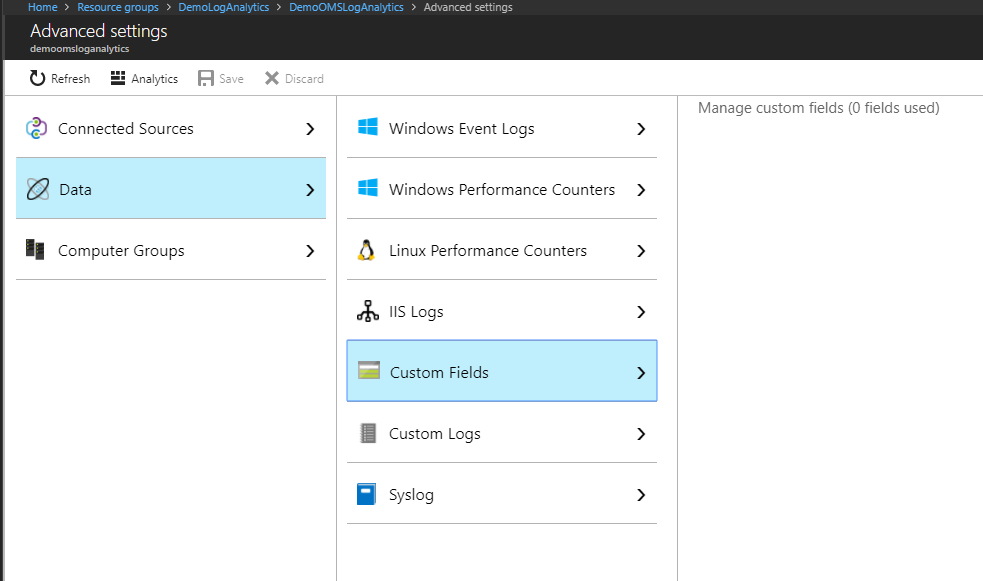
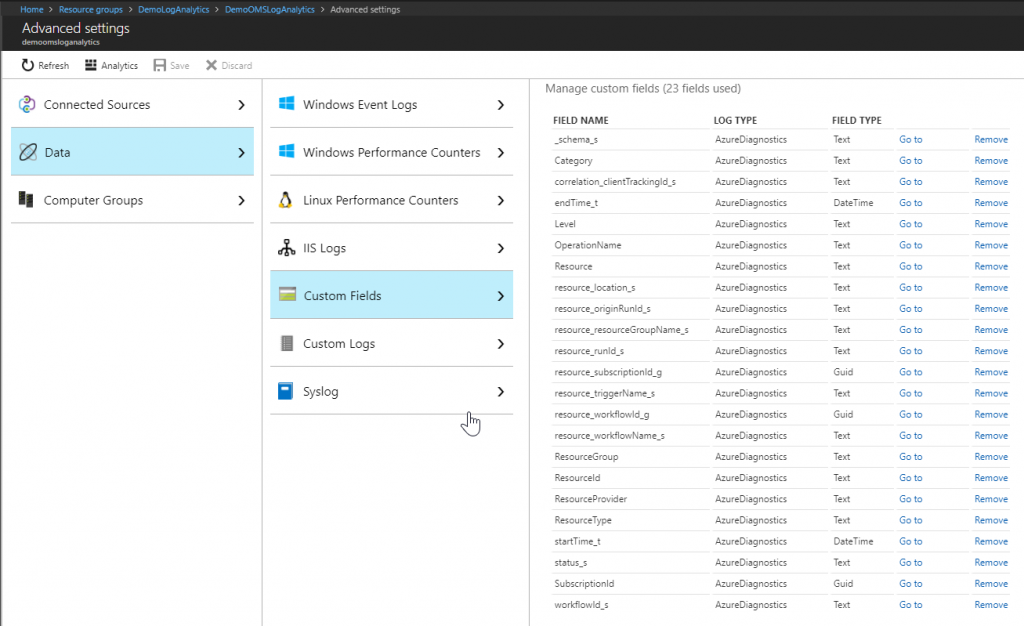
Also navigate to Advanced settings, Data, Custom Fields and note that nothing is there yet.
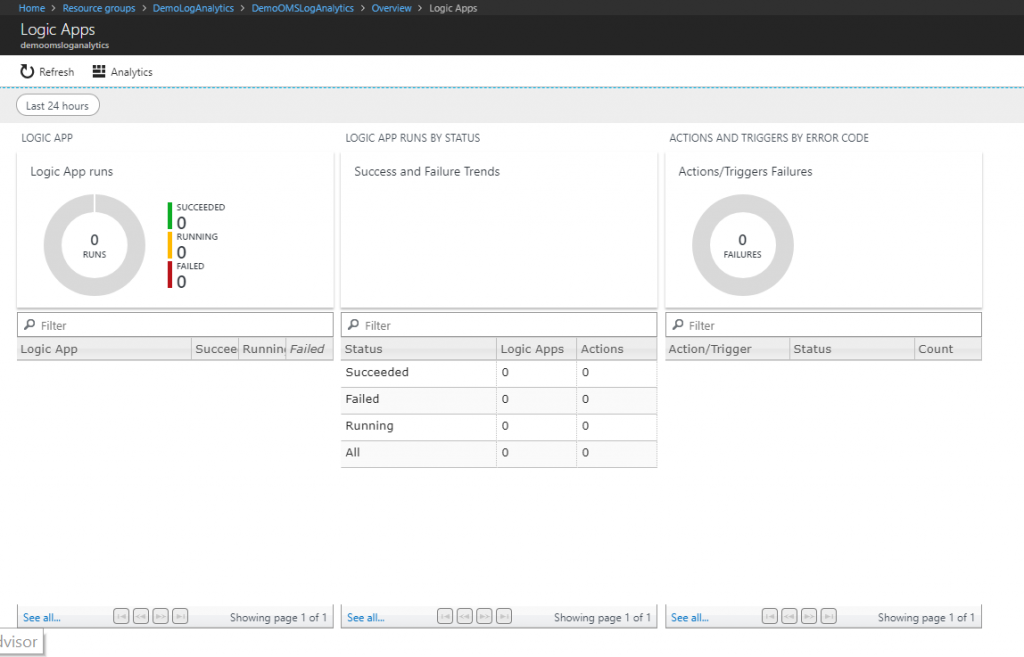
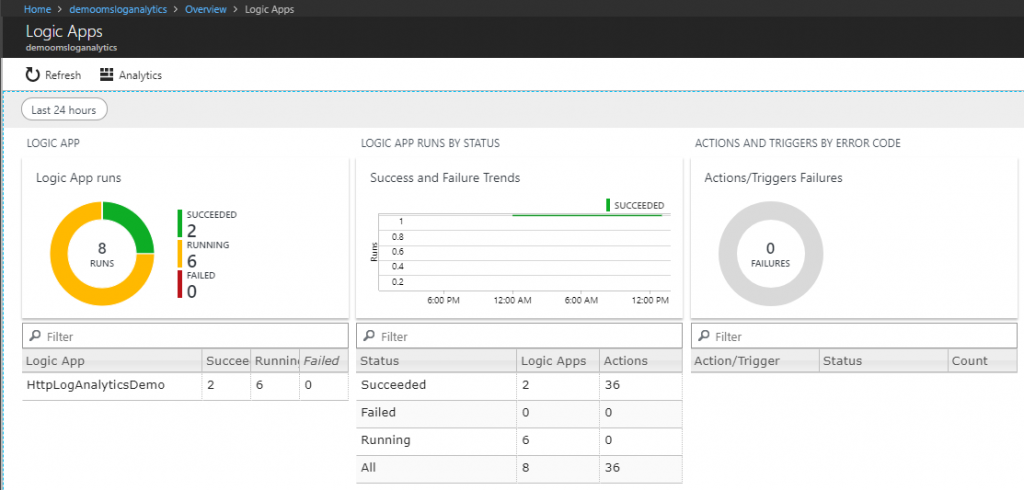
And finally, navigate to the Logic Apps Management solution. There’s no data there yet, so this is the results you will get from it.
Create the Logic Apps
Now we are going to create the Logic App that will send workflow runtime information to the Log Analytics workspace.
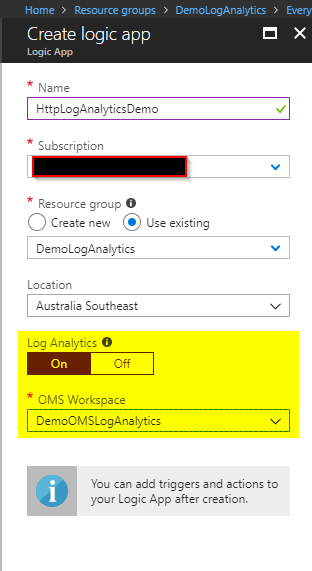
You probably have done the creation of a Logic App several times already, so the important part here is to turn on the Log Analytics option and to select the workspace we created previously.
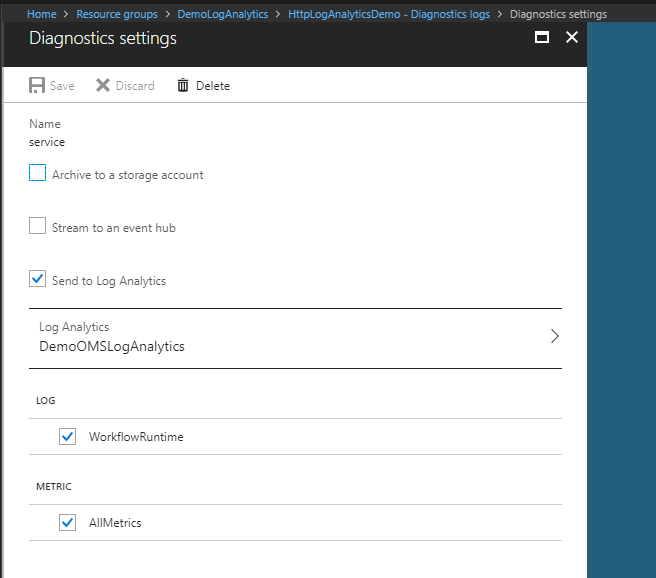
In case you already have the Logic Apps created, you can go to the Diagnostics logs option, enable it and then choose the Log Analytics workspace as the picture below.
Let’s navigate back to the Log Analytics, Azure Resouces and check that we have now the Logic App connected to this workspace.
The Logic App flow will be a simple HTTP request and response with a condition validation for some of the inputs as you can see in the picture below.
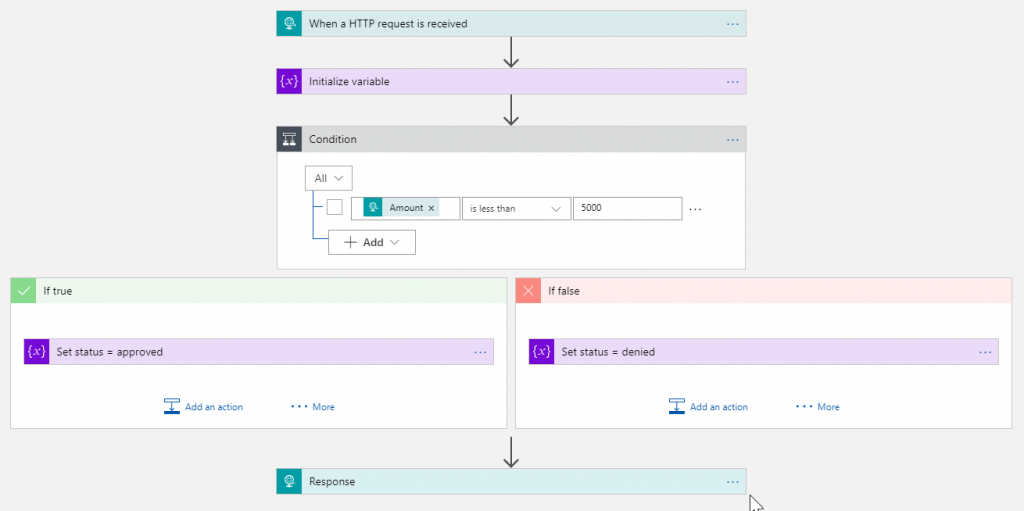
Here’s the link for the full JSON of this Logic App.
For now, I just want to see records showing up in the Log Analytics which may take some time. From 10 minutes to maybe 1 hour, so be patient.
Using postman or any other tool you prefer, fire some executions of this Logic App. Open the Log Analytics and execute the query as the picture below.
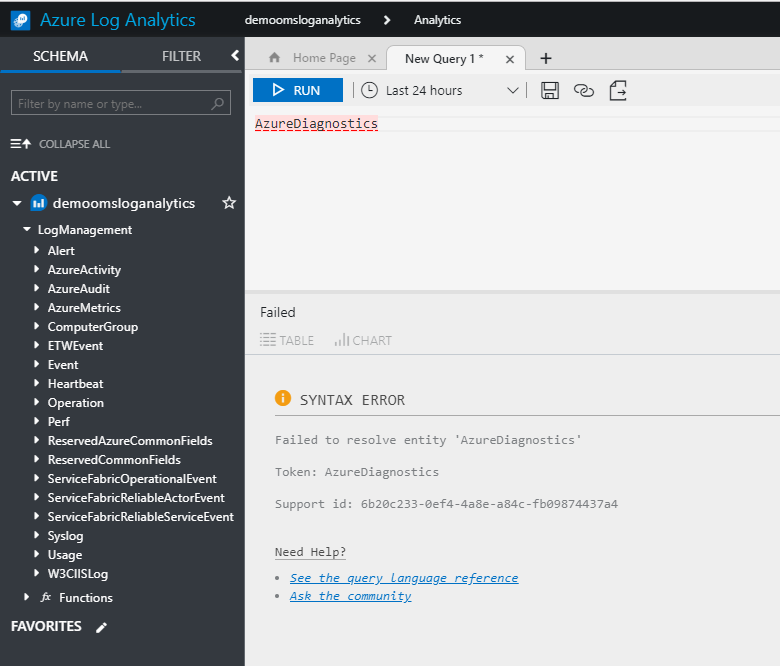
As you can see my query execution failed because I tried to execute it a few minutes after creating the Logic App. It will take some time, so wait until a table called AzureDiagnostics appears in there. Then you will be able to query the executions you fired.
… zzz … zzz …. zzz …
After 1 hour I could see that the AzureDiagnostics table (no data yet) was created in the Log Analytics workspace as well the custom fields for Logic Apps as below.
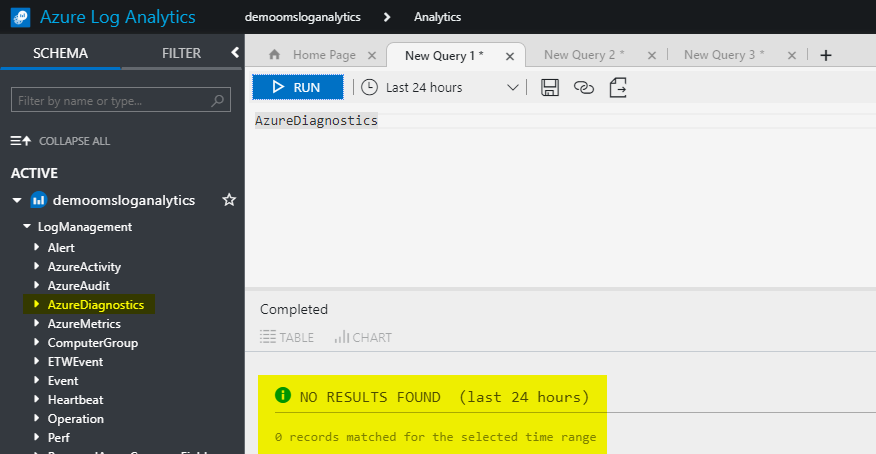
After 1.5 hours I finally have the data in Log Analytics. Now I can start playing with it and see what I can accomplish.
Querying the logged data in Log Analytics
Once all is working you will have data in Log Analytics and you can start using the Logic Apps Management solution.
You also can start making queries in the Log Analytics. For that refer to the documentation and to several blog posts on how to work with it as the query below that lists all records that shows when a Logic App has been executed and when it has been completed.
AzureDiagnostics

| where OperationName in ( "Microsoft.Logic/workflows/workflowRunStarted", "Microsoft.Logic/workflows/workflowRunCompleted" )

| project resource_runId_s, OperationName, TimeGenerated

| order by TimeGenerated desc
Tracked Properties in Logic App
Another thing we can do besides just logging the workflow actions and triggers is that we can also send some of the data of the messages as tracked properties to Log Analytics. For those who know BizTalk, it will give us capabilities similar to BAM (Business Analytics Monitoring).
We can add these properties in the actions that are part of our Logic App flow. To do so, you add the tracked properties in the JSON definition of the action you want to expose data.
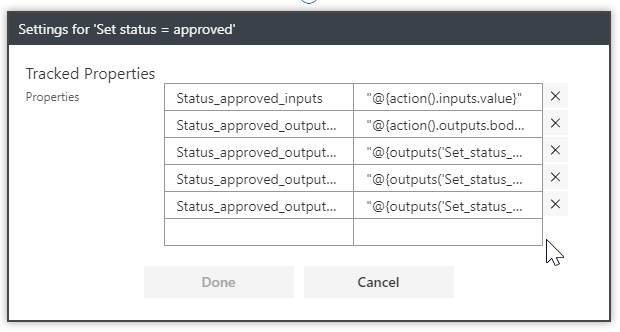
We have two options now. Work in the code-view and manipulate the JSON of the Logic App or use the designer in the Settings of the action you want to add the tracked properties where a new feature was just recently added. My personal preference is to edit the JSON but you can work with what works best for you.
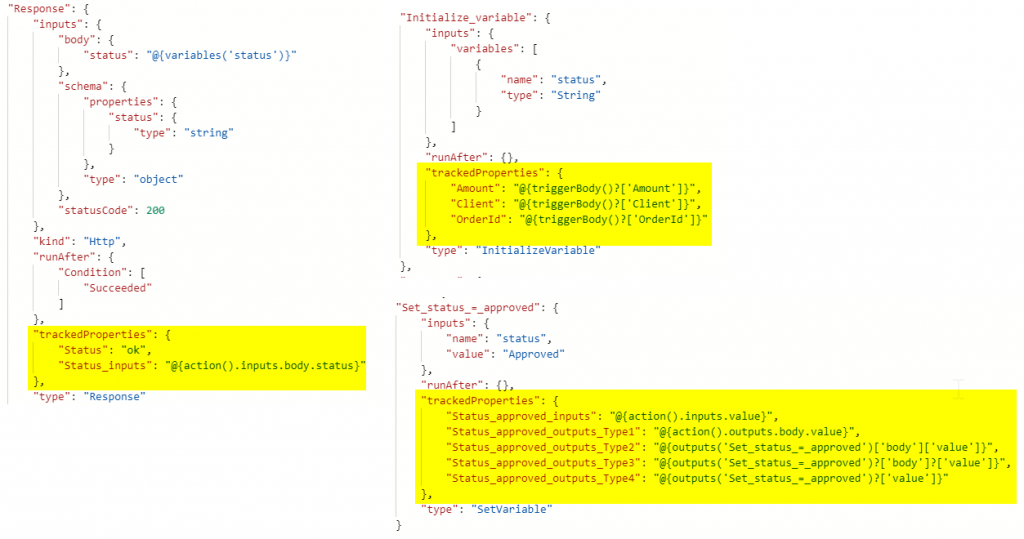
As you can see from the examples above we have a few options on how to reference the information we want to pass to the tracked property.
To help understand which one we can use, let’s talk the outputs of a trigger and the inputs and outputs of an action as an example.
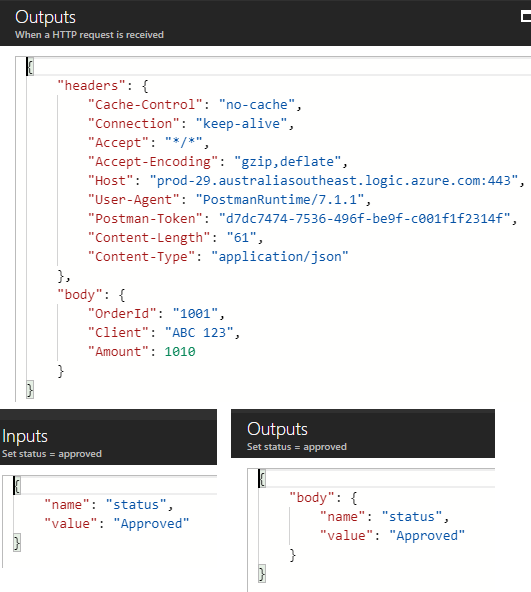
The first outputs in the picture above if of the trigger and the inputs and outputs below that are of an action. So to get information to send as a tracked property we have the following options:
- @triggerBody()[‘OrderId’] -> we can use this expression in any action;
- @action().inputs.value -> read the value from the input of the action we are adding the tracked property;
- @action().outputs.body.value or @outputs(‘Name_of_the_action’)[‘body’][‘value’] -> read the value from the output of the action we are adding the tracked property;
Please note that you need to be aware what is the JSON structure of the inputs and outputs, otherwise your flow will fail or you will not get the data sent to Log Analytics.
Also note that you can use the question mark in the expression, in that way if the field is not available it will not fail the Logic App execution. Ex.: @outputs(‘Name_of_the_action’)?[‘body’]?[‘value’].
Any change you make here by adding, updating or removing a tracked property will make the tracking to reindex itself, and it will take again some hours to the data to starting showing properly in Log Analytics. For me, it was always taking between 4 and 12 hours for this to happen, and you can imagine how annoying that was. I guess it will do the same, by just updating the Logic App even if there was no change in the tracked properties.
And one last thing I noticed is that I can’t use the @outputs or @action().outputs in the Http Response action. When I did that, the tracked property was not being properly tracked and it was even messing with the logging to be sent to Log Analytics.
Querying the Tracked Properties in Log Analytics
Now that you have also some of the information of the messages in Log Analytics, you can build your around that and have something like this. This query you can attach to an Azure Portal dashboard or create a new dashboard in OMS. You can even send this data to be used by Power BI and build your reports there. I will do a post about this in the future.
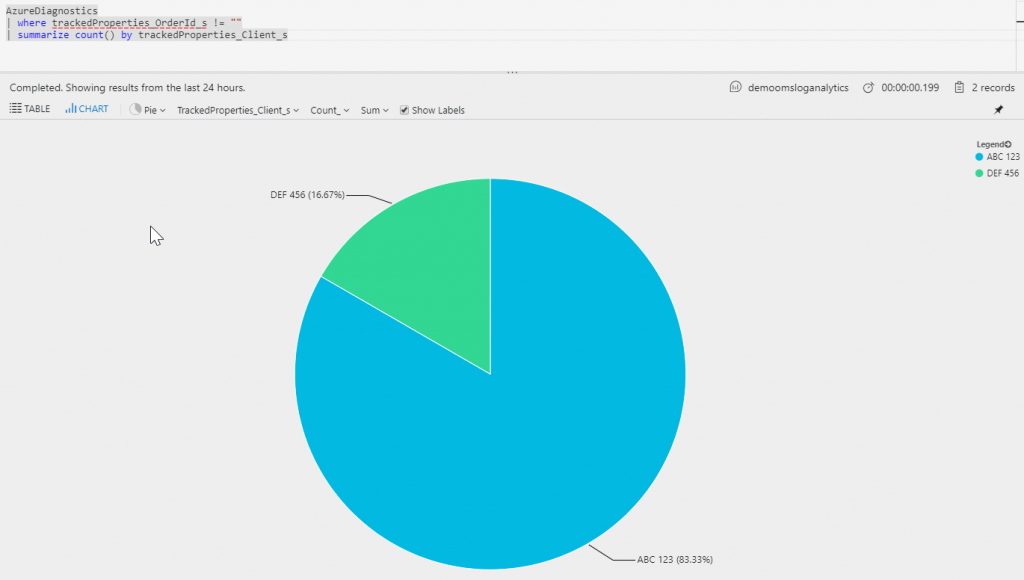
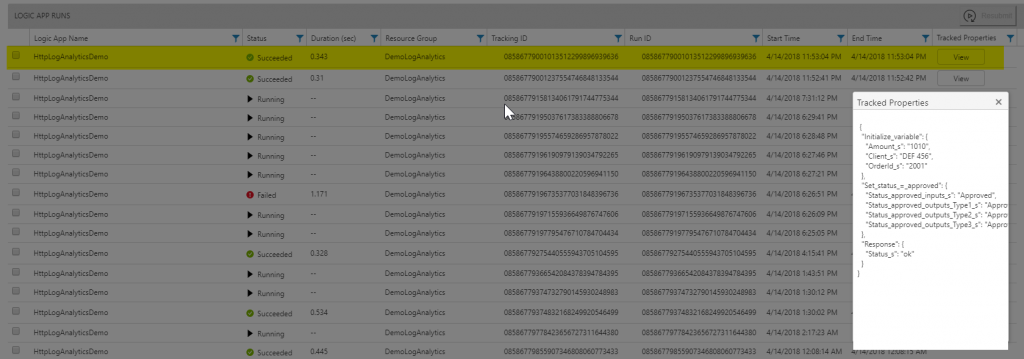
Below you can see the final results once the loggings are stabilized and I was not making any more changes to the Logic App. All tracked properties I added are showing up and the Status of the Logic App is showing up correctly now.
Behaviors and timing of logged data in Log Analytics
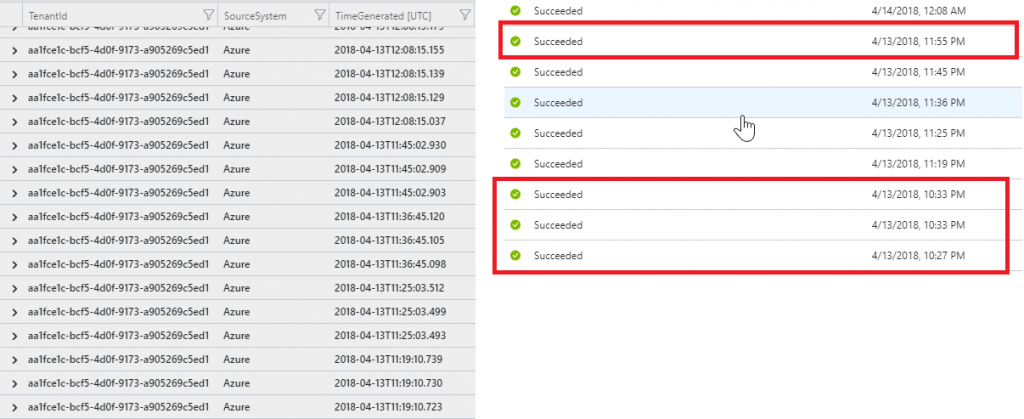
After a few fires of my Logic App, I noticed that not all data was logged properly. Some of the requests I did were simply not in Log Analytics as you can see in the picture below. So it seems we have a delay between saving the Logic App and actually being able to log the information in Log Analytics.
Microsoft has an SLA around how much time we should expect to see the data in Log Analytics and it’s of up to 6 hours, but they are targetting to have 95% of the data there in less than 10 minutes. Also be aware that there’s no SLA for the free tier.
https://azure.microsoft.com/en-us/support/legal/sla/log-analytics/v1_1/
About the missing records, I’m still waiting for a response from Microsoft, but it seems, that every time I did a change in the Logic App, (my personal guess) it takes some time to all internal changes to be applied everywhere and so some of the logs are just missed. I saw this behavior every time I did a change in the Logic App.
I noticed also that after about 12 hours after the last change in the Logic App, I start getting more consistent logs in Log Analytics. Still waiting for Microsoft to confirm these findings.
So whenever you are working with Log Analytics, please be patient and be aware that any change you make in the flow will require another kind of indexing to send this data to Log Analytics and it will take some time to be well synced.
Conclusion
Everything is really promising and it will help a lot to build Analytics on top of the Logic Apps integrations, but I think Microsoft needs to add more instrumentation on Logic Apps to help us identify when data are being synced correctly to Log Analytics, like adding a tracked properties visualization the same way we have for inputs and outputs. Another thing is to have more details about the timing of when to expect to have data in Log Analytics because right now is just a guessing game and the 12 hours that I experienced is very far from reasonable.

Great Article Alessandro. Keep going with the good work. See ya!
Thanks Michel. I’ll be posting more frequently. Keep coming back to see!!!