Before going into the subject of this post, I would like to share that I changed jobs this past month. I accepted an exciting position to work for ASB Bank as Integration Specialist and will be working with large volume transactions operations in the integrations throughout all the systems they have.
I will keep posting here maybe switching a little bit the technologies, but hopefully, I will be able to share how we are handling the architecture of these large volume integrations.
With that said, on one of my first conversations, I was asked how we could use Azure to help us build a logging framework to be used by all integrations in the Bank. In this post, I’m going to explain one of the options that came up, that may or may not be the one we choose, but in terms of architecture is a quite cool one.
This logging framework should be able to handle two things primarily: logging errors and frauds detection. In the next sections, I’ll show how we implemented both, at least the technical pieces that I can show here targeting for simplicity and also for privacy.
Architecture
The architecture of this logging framework that needs to receive data from several applications with millions of requests per day needs to be quite comprehensive and take the high load very seriously, otherwise, the solution will not be able to handle the proposed volume.
One of the technologies that we wanted to use is Azure Event Hubs. Here are the following quotes from its website: “is a fully managed, real-time data ingestion service”, “stream millions of events per second from any source”, “integrated seamlessly with other Azure services to unlock valuable insights”.
The other proposed technology is Azure Stream Analytics. This one will be responsible to query the data sent to Event Hubs and for the error logging, to send the prepared data to be shown in dashboards and for the fraud detection, to start a workflow that will handle the problem using Service Bus and Logic App.
Below, you can see the diagram of the proposed architecture:
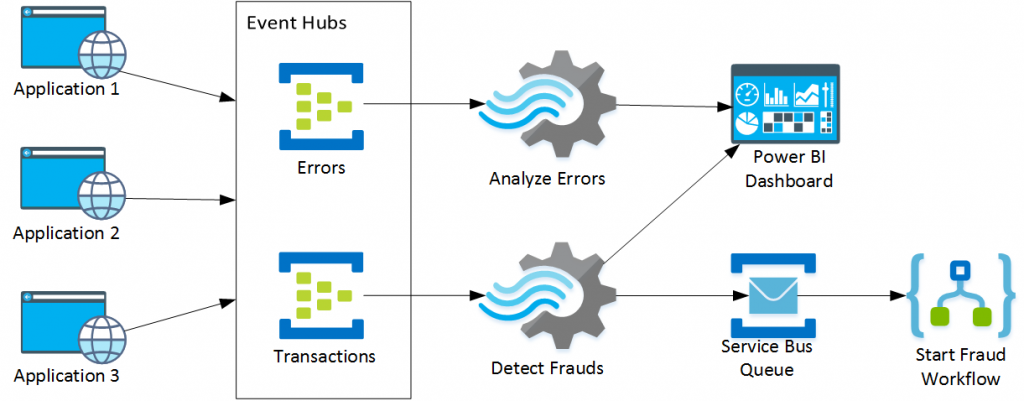
As you can see, we will have two Event Hubs to receive messages about error logs and transactions processed. For the Errors Event Hub, we are going to extract data using Stream Analytics and then forward the data to Power BI. For the transactions Event Hub, we will use a query to detect possible frauds and for the ones identified, we will send a message to a Service Bus Queue that will be picked up later by a Logic App that will do the workflow to handle the fraud. We will also send the transactions to Power BI to show how clients work with their accounts.
Also, Be on top of messaging issues with proactive Azure Service Bus monitoring on dead-letter messages across multiple Queues and Topic Subscriptions.
Event Hubs
Let’s start with the creation of a new Event Hubs namespace as the picture below:
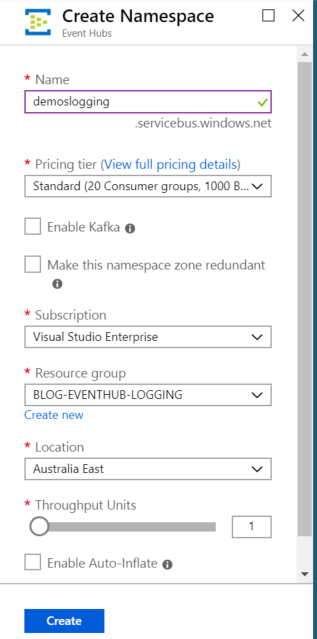
Since it’s a demo, I used the Standard pricing tier and only one throughput unit, but whenever the load increases we can change these properties to support it.
After the creation of the namespace is complete, create also the Event Hubs for Errors and Transactions. Again, I just used 1 partition count, since I’m just looking to demo this architecture. These values need to be adjusted to the load on your environment.
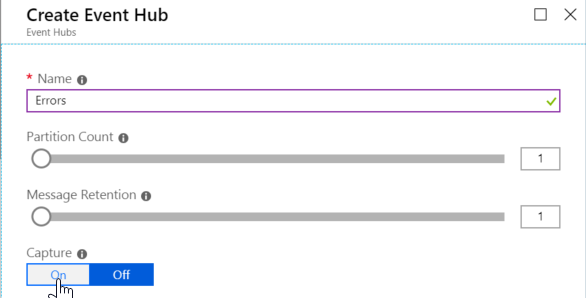
Create two shared access policies to be able to send and retrieve data from these event hubs. Name them as Publisher and Consumer. For the Publisher SAS policy, just select the permission “Send”. For the Consumer SAS policy, just select the permission “Listen”. You will specify which one to use on your client applications later.
Test Applications
Now that we have the Event Hubs in place we need to create our test applications simulating both the sending of error logs as well as transaction details so we can both understand in which application/location the errors are occurring as well as preventing frauds by using an algorithm (query) in Stream Analytics.
Error Logging Test Application
I will not go over all the details of creating a publisher application for Event Hubs, since there are good documentation about this here:
https://docs.microsoft.com/bs-cyrl-ba/azure//event-hubs/event-hubs-dotnet-standard-getstarted-send.
If you want to check my full implementation, just go over at my GitHub in the following location and download the source code:
https://github.com/alessandromoura/RealTimeAnalyzer
For now, let’s go over only to the main details of my test application. First the content of the data that we will send to Event Hub as the code below shows:
|
1 2 3 4 5 6 7 8 9 10 11 12 13 14 15 16 |
class ErrorDetail { public string AppName { get; set; } public string Username { get; set; } public string Description { get; set; } public string AppType { get; set; } public string Region { get; set; } public DateTime Date { get; set; } public double Latitude { get; set; } public double Longitude { get; set; } public override string ToString() { return $"{AppName},{Username},{AppType},{Region},{Date},{Description}"; } } |
To test the behavior of all pieces or the proposed architecture, this application will simulate the sending of errors every 1 to 5 seconds randomizing the properties in the class above. Check below some of my randomizing functions:
|
1 2 3 4 5 6 7 8 9 10 11 12 13 14 15 16 17 18 19 20 21 22 23 24 25 26 27 28 29 30 31 32 33 34 35 36 |
static Location RandomizeLocation() { City city = (City)new Random().Next(0, 20); switch (city) { ... case City.Wellington: return new Location() { Latitude = -41.28889, Longitude = 174.77722, Region = city.ToString() }; case City.Auckland: return new Location() { Latitude = -36.85, Longitude = 174.78333, Region = city.ToString() }; ... default: throw new Exception("Error calculating location"); } } static string RandomizeText(string text, int options) { Random x = new Random(); return $"{text} {x.Next(1, options)}"; } static string RandomizeAppType() { int appType = new Random().Next(2); if (appType == 1) return "Mobile"; else return "Browser"; } static DateTime RandomizeDate() { Random x = new Random(); return new DateTime(2019, x.Next(3, 5), x.Next(1, 30), 0, 0, 0); } |
The rest of the code is about calling the randomizing methods for the properties of the error log class and sending the message to Service Bus with an interval of 1 to 5 seconds as you can see below:
|
1 2 3 4 5 6 7 8 9 10 11 12 13 14 15 16 17 18 19 20 21 22 23 24 25 26 27 28 29 30 31 32 33 34 35 36 37 |
static ErrorDetail CreateMessage() { Location loc = RandomizeLocation(); ErrorDetail ed = new ErrorDetail() { AppName = RandomizeText("Application", 5), Username = RandomizeText("Username", 500), Description = RandomizeText("Error type number", 100), Region = loc.Region, AppType = RandomizeAppType(), Date = RandomizeDate(), Latitude = loc.Latitude, Longitude = loc.Longitude }; return ed; } static void Main(string[] args) { ... var errorsTask = Task.Run(async delegate { Console.WriteLine("Errors task started!!!"); while (!cts.IsCancellationRequested) { int timeout = new Random().Next(1000, 5000); var msg = CreateMessage(); await Task.Delay(timeout); Publish(msg); Console.WriteLine($"Message sent: {msg.ToString()}"); } }); ... } |
Transaction Test Application
For this test application, the main difference is the class that represents the message we are sending to Event Hubs. The other thing is that we are randomizing the amount to send. You can see below the code that we are using to send the message to Event Hubs:
|
1 2 3 4 5 6 7 8 9 10 11 12 13 14 15 16 17 18 19 20 21 22 23 24 25 26 27 28 29 30 31 32 33 34 35 36 37 38 39 40 41 42 43 44 45 46 47 48 49 |
class Transaction { public string AppName { get; set; } public string Region { get; set; } public decimal Amount { get; set; } public string Account { get; set; } public DateTime Date { get; set; } } static decimal RandomizeAmount() { Random x = new Random(); return (decimal)Math.Round(x.NextDouble() * 1000, 2); } static Transaction CreateTransaction() { Location loc = RandomizeLocation(); Transaction trn = new Transaction() { AppName = RandomizeText("Application", 10), Region = loc.Region, Account = RandomizeText("Account", 100), Amount = RandomizeAmount(), Date = RandomizeDate() }; return trn; } static void Main(string[] args) { ... var transactionsTask = Task.Run(async delegate { Console.WriteLine("Transactions task started!!!"); while (!cts.IsCancellationRequested) { int timeout = new Random().Next(1, 50); var msg = CreateTransaction(); await Task.Delay(timeout); Publish(msg); Console.WriteLine($"Message sent: {msg.ToString()}"); } }); ... } |
The only other difference is that in this application, we are simulating a delay of only 1 to 50 milliseconds between sending data to Event Hubs. The reason for this is to simulate a higher load since transactions will happen much more than errors (hopefully).
Stream Analytics Jobs
For Stream Analytics, we also need to create resources in Azure. To do so, go to the Azure Portal and create new resources of type Stream Analytics Job. One for the error logging analyzer, and another for the fraud detection. Leave the Hosting environment as Cloud and the streaming units as 1 for each one of them.
Logging Error Job
Stream Analytics requires the configuration of the inputs, outputs, and the query to be performed on the data that is being received. There’s also the option to work with Azure Machine Learning functions created previously, which will give us access to more powerful analyzers than a simple query, but this will be for another post.
For this Logging Error job, we are going to receive the data sent to Event Hubs, query the data grouping by AppType, AppName and Region while getting the average of Latitude, Longitude and counting the number of messages for a particular grouping.
Input
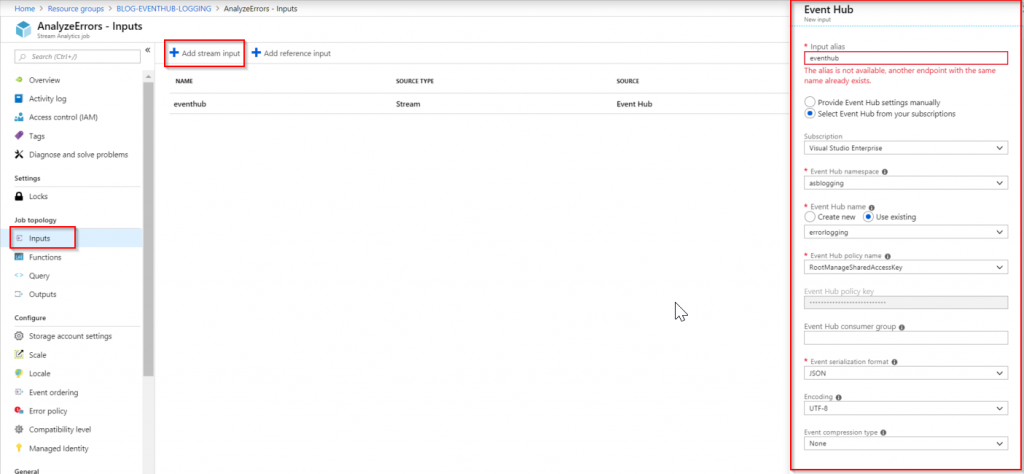
For receiving data from Event Hubs, go to the Inputs and click on Add stream input and then Event Hub. Give an alias for the input, select the event hub you want to connect to and define properties like consumer group, serialization format, encoding and compression type as the picture below shows:
Output
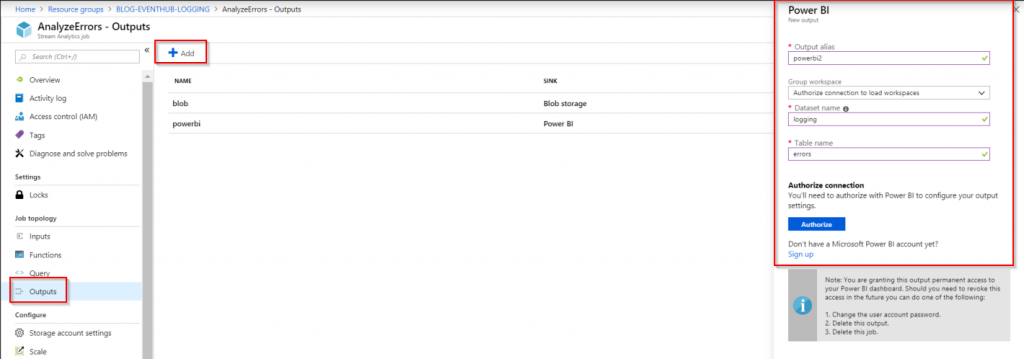
We want to send the results of the query to Power BI, and to do so, we need to create an ouput in an instance of Power BI. Define the alias of the output, the dataset name and table names to be created in Power BI. You need to authenticate to the subscription you have in Power BI.
Query
Once both input and output are created, we can create the query that this stream analytics job will use. Stream Analytics queries use the same syntax of SQL Server queries with minor differences. To this one, just copy and paste the code below:
|
1 2 3 4 5 6 7 |
SELECT AppType, AppName, Region, AVG(Latitude) as Latitude, AVG(Longitude) as Longitude, COUNT(*) as Quantity INTO [powerbi] FROM [eventhub] GROUP BY AppType, AppName, Region, TumblingWindow(minute, 5) |
This query will basically show errors aggregated by AppType, AppName, and Region, with Latitude and Longitude averages and a count of errors.
We are going to use this data in Power BI to show a map where most errors are happening.
Fraud Detection Job
For this job, we are going to get data from Event Hub and query only the records that have more than 1 transaction for the same account in different locations in an interval of 10 minutes. Of course, this query is just for this demo purpose and does not represent what the actual query would be. As I mentioned previously, in a real-world implementation, I would probably go with a Machine Learning query to determine all the possible situations of a fraud, but for this example, this will be enough.
Input
We will again get data from Event Hub so we need to configure the input one more time, but this time targeting the transaction Event Hub. Use the consumer SAS key to read data from the Event Hub.
Output
As output, we are going to send data to Service Bus this time, so we need to create an output as below:
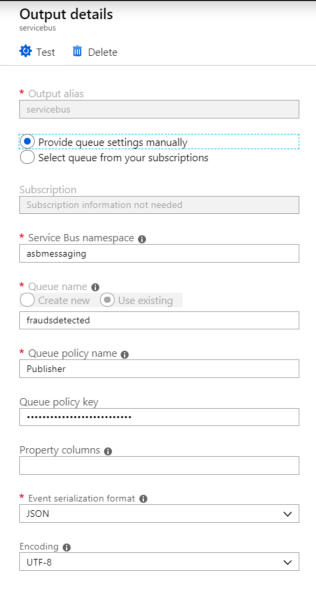
As you can see from the picture we are sending messages to a queue called fraudsdetected and we are using a Publisher SAS key created previously.
I’m also sending transaction details to Power BI so we can analyze how transactions are being performed by our clients. For that, we need a query that covers both scenarios. We also need the same powerbi output created in the other Job Analytics Job in this one.
Query
The query we are executing in Stream Analytics will capture more than 1 transaction executed in 2 locations in a period of 2 minutes and will send the accounts identified to Service Bus. It will also capture transaction records group by AppName, Region and Date and it will send to Power BI.
|
1 2 3 4 5 6 7 8 9 10 11 12 13 14 15 16 17 18 19 20 21 22 23 24 25 26 27 28 |
WITH TransactionsPerRegion AS ( SELECT Account, Region, COUNT(*) Quantity FROM [eventhubs] TIMESTAMP BY EventProcessedUtcTime GROUP BY Account, Region, TumblingWindow(minute, 2)) SELECT t.Account, COUNT(*) INTO [servicebus] FROM TransactionsPerRegion t LEFT JOIN eventhubs e TIMESTAMP BY EventProcessedUtcTime ON t.Account = e.Account AND DATEDIFF(minute, t, e) BETWEEN 0 AND 1 GROUP BY t.Account, TumblingWindow(minute, 2) HAVING COUNT(*) > 1 SELECT AppName, Region, Created, SUM(Amount) INTO [powerbi] FROM [eventhubs] TIMESTAMP BY EventProcessedUtcTime GROUP BY AppName, Region, Created, TumblingWindow(minute, 2) |
Power BI Dashboard – Error Logging and Transactions
Now that the resources in Azure are configured, we can start the Stream Analytics Jobs. After that, start the test console applications.
In 2 minutes (as configured in the Stream Analytics queries), you should be able to start seeing data in Power BI.
In Power BI, create the visualizations you want for this data. I did the following dashboard to show the data sent there:
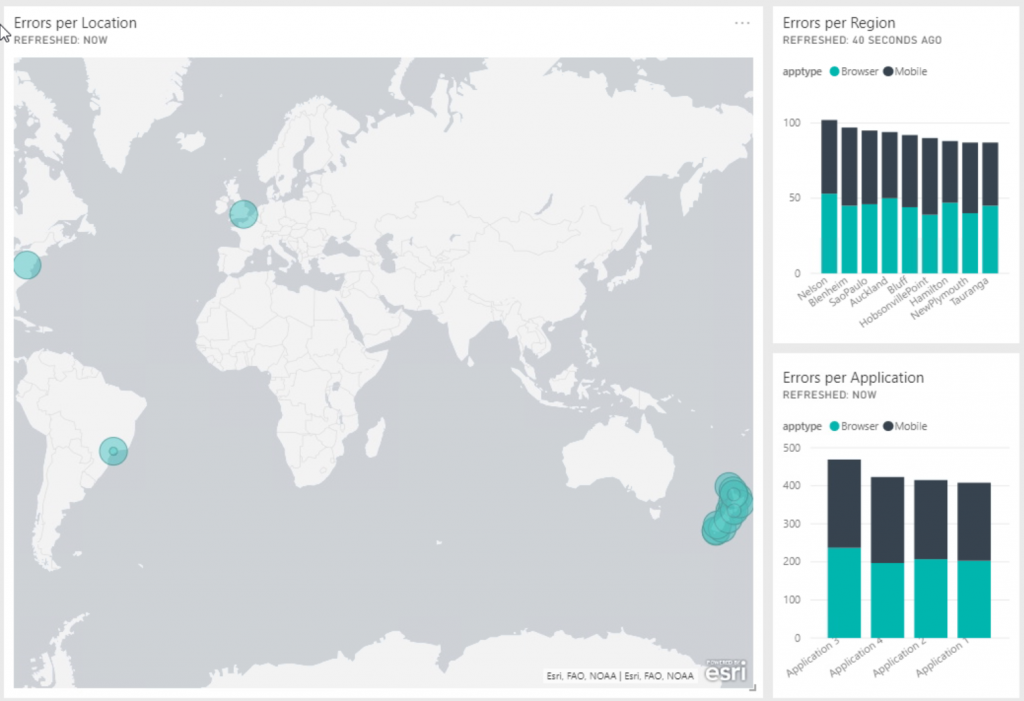
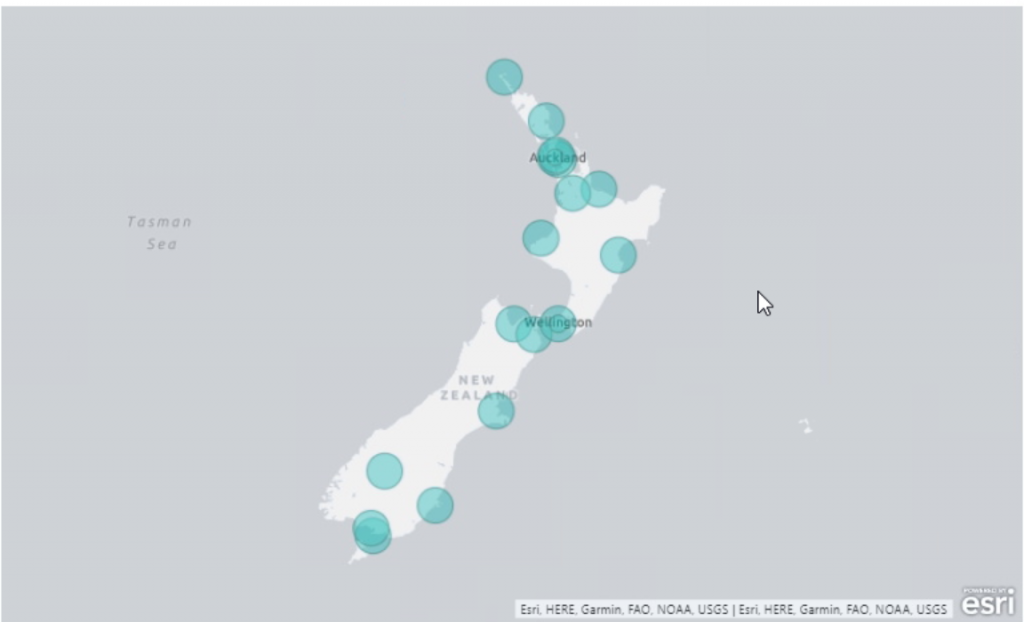
Since we have the Latitude and Longitude, we can use the map graph to plot this data for us in a nice, beautiful and easy way.
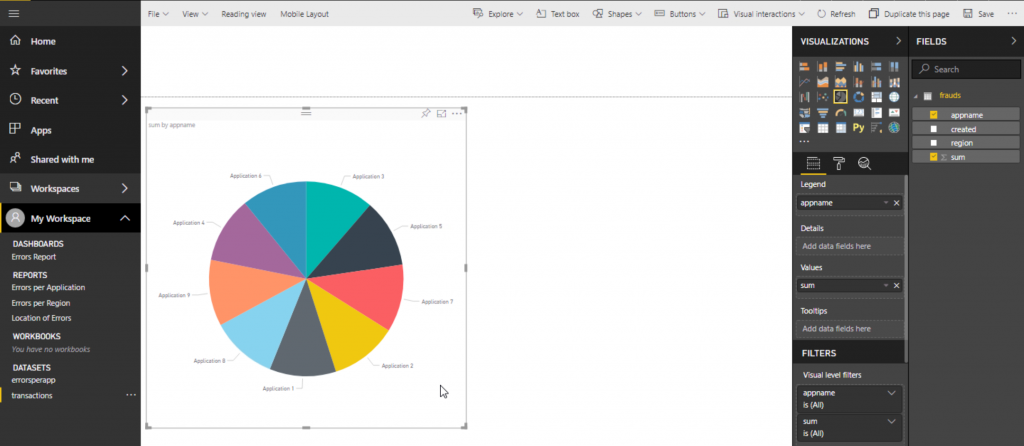
Just to show a little bit more of the creation of the reports, this is waht you see in Power BI when creating them. You can see the list of datasets we are sending from Stream Analytics in the bottom left, when we choose one of the datasets, we are presented with the charts we can plot and the fields to add to these charts. Pretty straightforward and easy to work with.
Logic App Fraud Workflow – Fraud Detection
The last thing we need to do is to create the Logic App, that will receive the message from the Service Bus queue and will notify the client that a fraud has occurred and actions need to be taken.
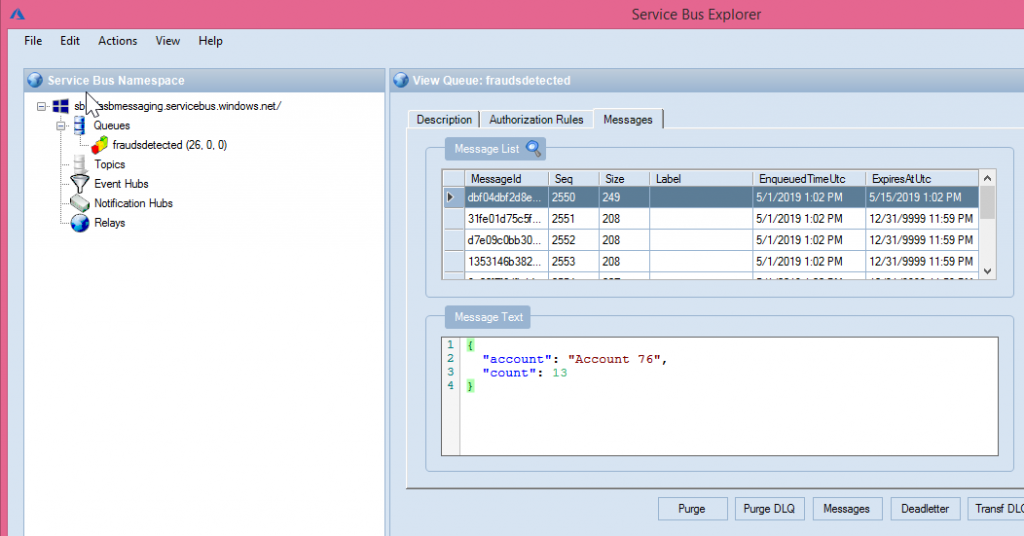
Since our Stream Analytics Job for fraud detection is capturing possible frauds in a 2 minutes time window, the queue in Service Bus started receiving the messages with the details about the possible frauds. Using the Service Bus Explorer we can see what has been sent there:
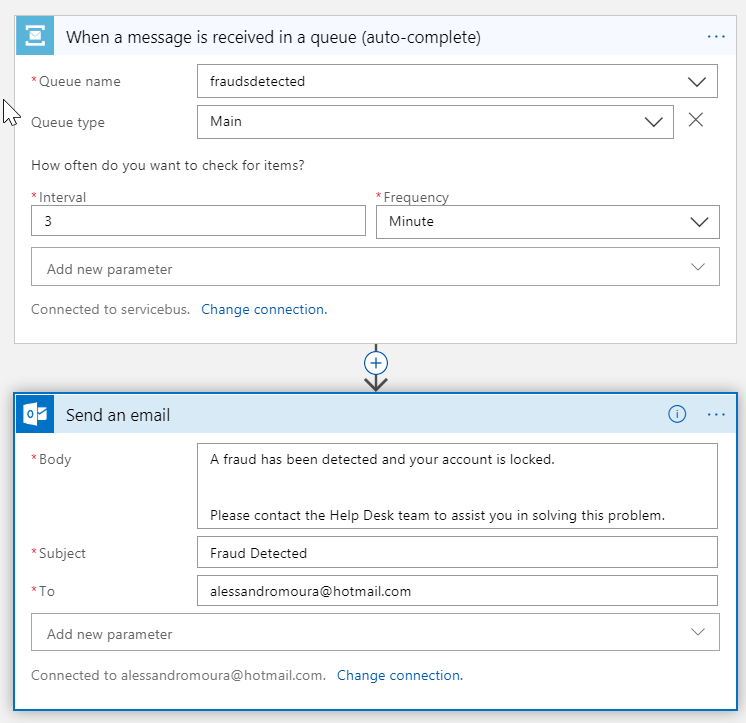
Once the message is in Service Bs, the Logic App can pick the message up and do the required work. For simplicity here, I’m just receiving the message in and sending an email informing the client of the problem that happened as you can see below:
In a production environment, I would be communicating with all the security systems, to make sure that the account will not accept any more transactions until the security team solves the problem with the client.
Summary
Azure presents us with so many tools and technologies to attend the needs of the organizations we work for. And they are simple to use, but quite effective.
I spent about 1 hour of work to create the code, the Azure resources and the Power BI dashboards, the rest of the heavy work was done by these amazing technologies offered by Azure.
Hope you guys enjoyed the reading. See you around!!!


